
Why we watch the highlights
Examining the factors determining viewership of rugby league match highlights
What makes us watch online video highlights of sporting events?
Is it our desire to see an underdog snatch victory from the hands of a giant?
Is it our pleasure in viewing all scoring events in one small package?
Is it our love for a certain team?
Is it a nail-biting score line?
Or is it something else?
In this report I present an analysis on the topic of the National Rugby League (NRL) and the factors which determine the viewership ratings of NRL match highlights videos on YouTube.
Click here to watch my video presentation of the report or scroll down to read the full report
Contents
-
-
How much variation in viewership is there for NRL match highlights videos on YouTube?
-
How do view counts differ based on the popularity and strength of the teams?
-
How do view counts differ based on the expected result of a match?
-
Do view counts differ based on score line and number of points scoring events?
-
Do view counts differ based on time of the year and/or based on Channel Nine broadcasting?
-
-
Modelling the Relationship between Video Views and determining factors
Project Background
This report documents the findings of a June 2020 study examining data pertaining to National Rugby League (NRL) matches from the 2019 NRL season.
The purpose of this study is twofold:
- Gain an understanding as to what influences viewership of NRL match highlights
- Provide actionable insights for operators within the NRL to effectively influence strategic decision making
Project Methodology: Data Collection and Preparation
Extracting YouTube Data
To understand the factors influencing the viewership numbers of NRL match highlights, data from YouTube was extracted and used as both dependent and independent variables in the analysis of this project.
Over the course of the 2019 NRL season the NRL on Nine YouTube channel uploaded highlights videos of each NRL match from the regular season fixture list (excludes finals matches). Each match highlights video was uploaded on the channel within a few hours of the completion of the corresponding live match.
Phase 1 of this project involved extracting the viewership numbers of these videos, as of June 2020.
The specific method to extract this data involved the use of the YouTube Data API and various programming functions within Python.
As a result of this data extraction process, data from 192 YouTube videos (pertaining to 192 regular season NRL matches) was consolidated into both Python and Excel.
Removing cases from the YouTube dataset
One unfortunate characteristic of the dataset extracted from YouTube pertains to the viewership restriction settings for each video. 187 of the 192 videos are restricted to Australian viewers only. Thus, the 5 videos which do not have this restriction, were removed from the analysis.
Furthermore, because New Zealand viewers are unable to view the videos, it is assumed that viewership numbers of videos featuring the New Zealand Warriors team will be significantly affected.
Thus, all videos of New Zealand Warriors matches were removed from the analysis.
A total of 163 games remained as viable datapoints for analysis.
Sourcing independent variable data
Besides YouTube data, data pertaining to match and team statistics were sourced via web scraping various websites and consolidating the data into data frames within Python.
The predominate source of match data came from Fox Sports.
Furthermore, custom data metrics were created within Python and Excel by transforming the primary data scraped from websites such as Fox Sports.
About the Dataset
163 games (cases) are included in the analysis.
The ‘YouTube video views’ metric is portrayed throughout this report and represents the amount of views a match highlights video received on the NRL on Nine YouTube channel (as at June 2020).
In this report I explore the relationship between the YouTube video views variable and the following independent variables:
- Supporter levels of each team
- The strength (recent results) of a team going into a match
- The degree to which the winner of a match was expected to win
- Number of tries scored in a match
- Whether a field goal was scored in a match
- The final score-line margin of a match
- The biggest score-line margin throughout a match
- The number of tries/field goals scored in the last 15 minutes of a match
- The specific round a match is held in
- The match attendance figure
- Whether or not the match was televised live on Channel Nine
- The durational length of the match highlights video
Analysis
How much variation in viewership is there for NRL match highlights videos on YouTube?
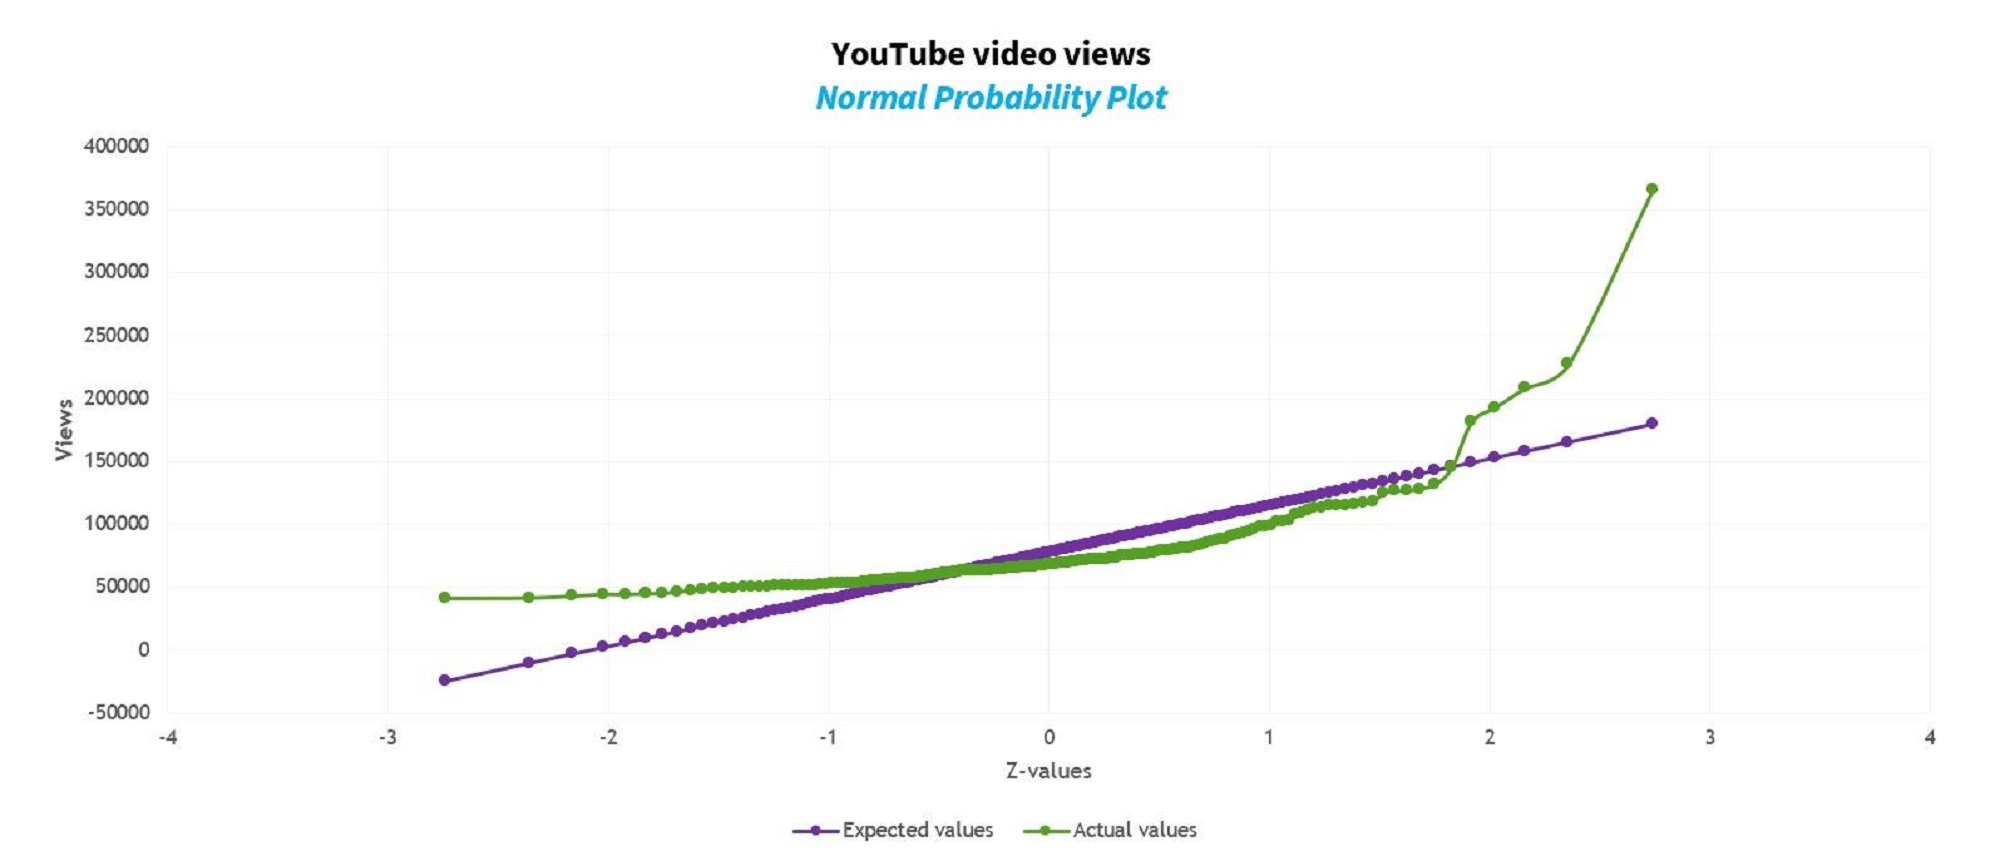
The YouTube video views dataset does not resemble a normal distribution, as clearly evidenced by the normal probability plot (green line) displaying an upwards concavity relative to what we would expect from a normal distribution (purple line).
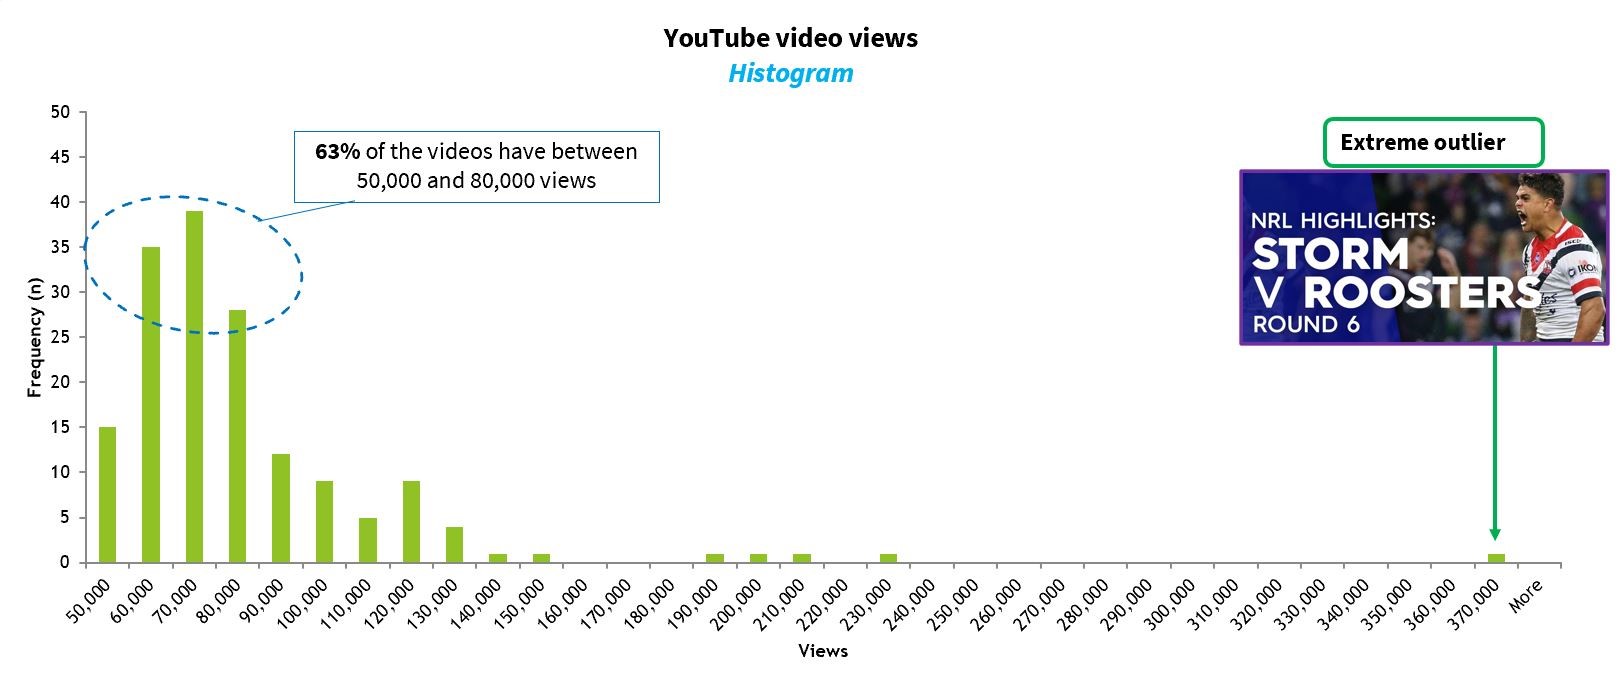
Observing the above histogram, the majority (85%) of videos have less than 100k views. And quite a large proportion (63%) of videos have between 50k and 80k views.
The dataset is heavily skewed to the right due to several extreme outliers existing, including one video with 366k views.
There is nothing bad per se about a non-normal distribution. It just means that if these observed values were to be used to predict future video view values using a regression model then the outliers would need to be monitored carefully in relation to the model output generated.
Examining the outliers
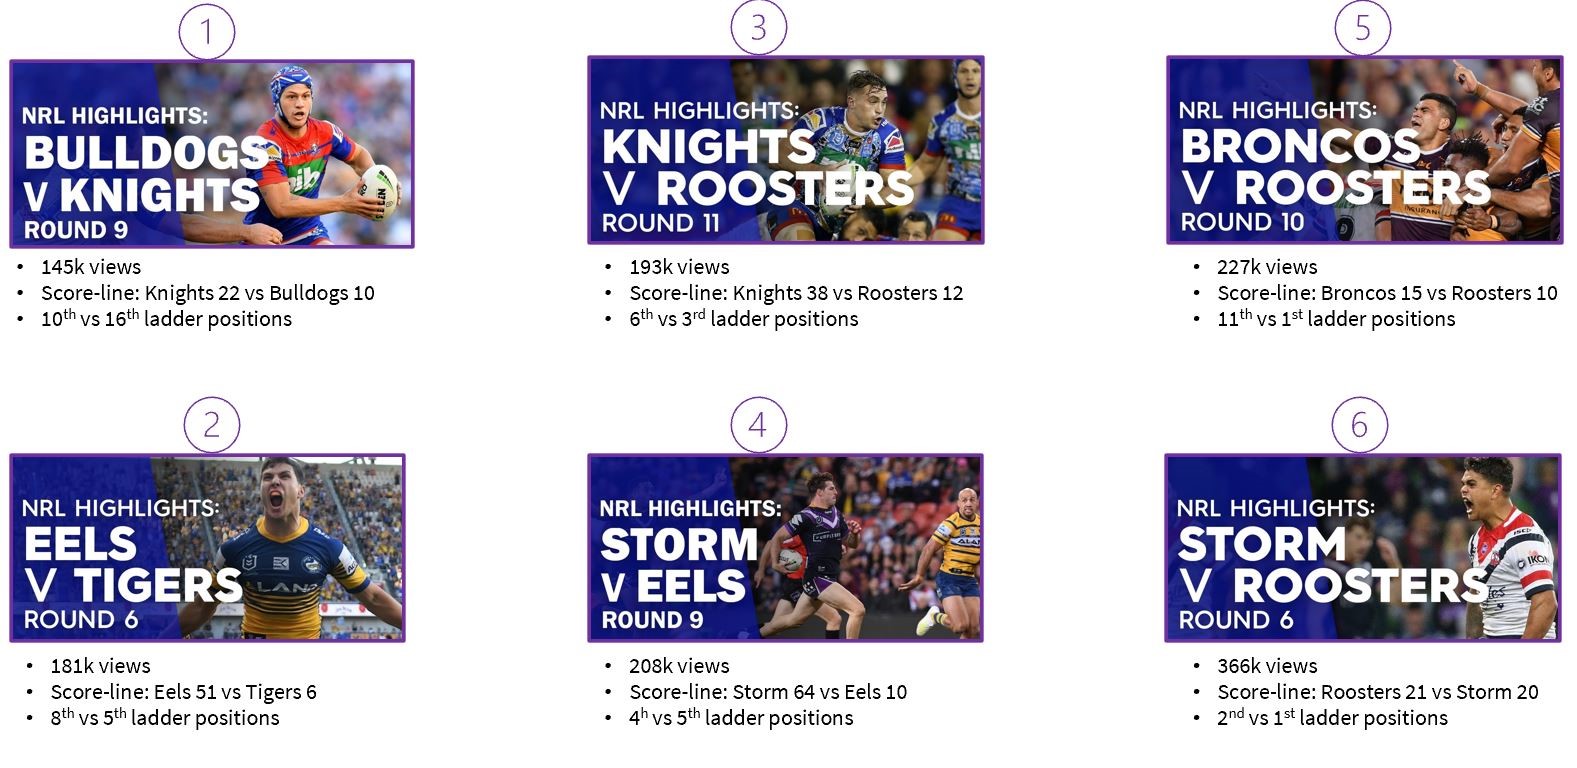
I have deemed there to be six major outlier data points in the dataset and have brief characteristics of each outlier are listed above.
Scanning the characteristics of each outlier, you can see there are a mixture of score lines and ladder positions, although the biggest outlier features a 1-point final score line margin and has the top two rank teams versing each other. The outliers (the six matches) all occurred between rounds 6 and rounds 11.
Upon watching these videos, and through the lens of a hardened rugby league consumer, you will notice that a lot of quality and unique tries were scored. Furthermore, in-game crowd attendance and engagement are relatively high.
An understanding of the characteristics of the outliers in the dataset helped to steer the direction in which I took my exploratory analysis as well as when drawing conclusions and recommendations.
How do view counts differ based on the popularity and strength of the teams?
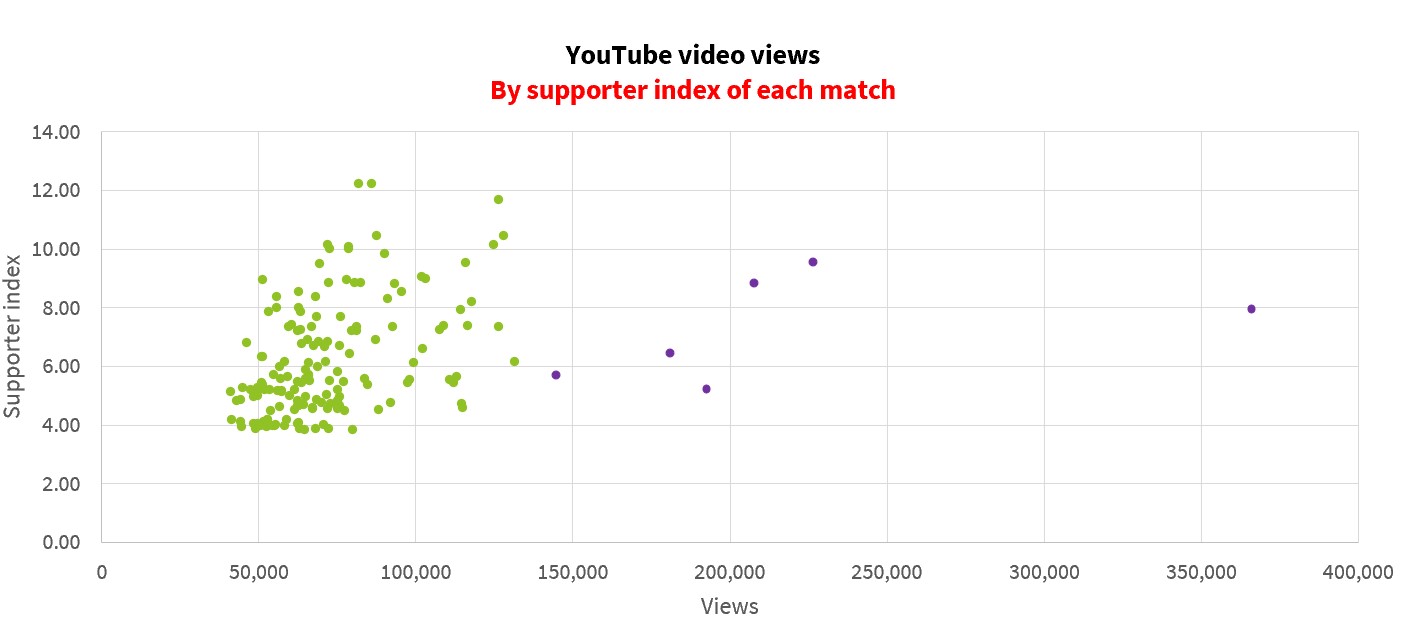
Featured above is a scatterplot with each dot representing one of the 163 matches in the dataset. The horizontal axis measures the YouTube video viewership counts for each match and the vertical axis is what I have coined the Supporter Index, which measures the level of support for the two teams featured in each match.
The supporter index is calculated by using each club’s official Facebook page likes count (as at June 2020) and 2018 end of year club membership numbers. The index score is a standardized value in which the Facebook page likes value is given a 90% weighting and the membership numbers a 10% weighting.
There exists a moderate positive correlation (+0.35) between video viewership numbers and the supporter index. This correlation score increases to +0.46 upon removing the six outliers (coloured purple) from the calculation.
In other words, looking across different matches, as the supporter levels of the teams involved in a match increases, views tend to also increase – but the relationship is only moderate. Which makes sense, as you would expect that more heavily supported teams drive higher video views but that it could not be the sole factor that drives views.
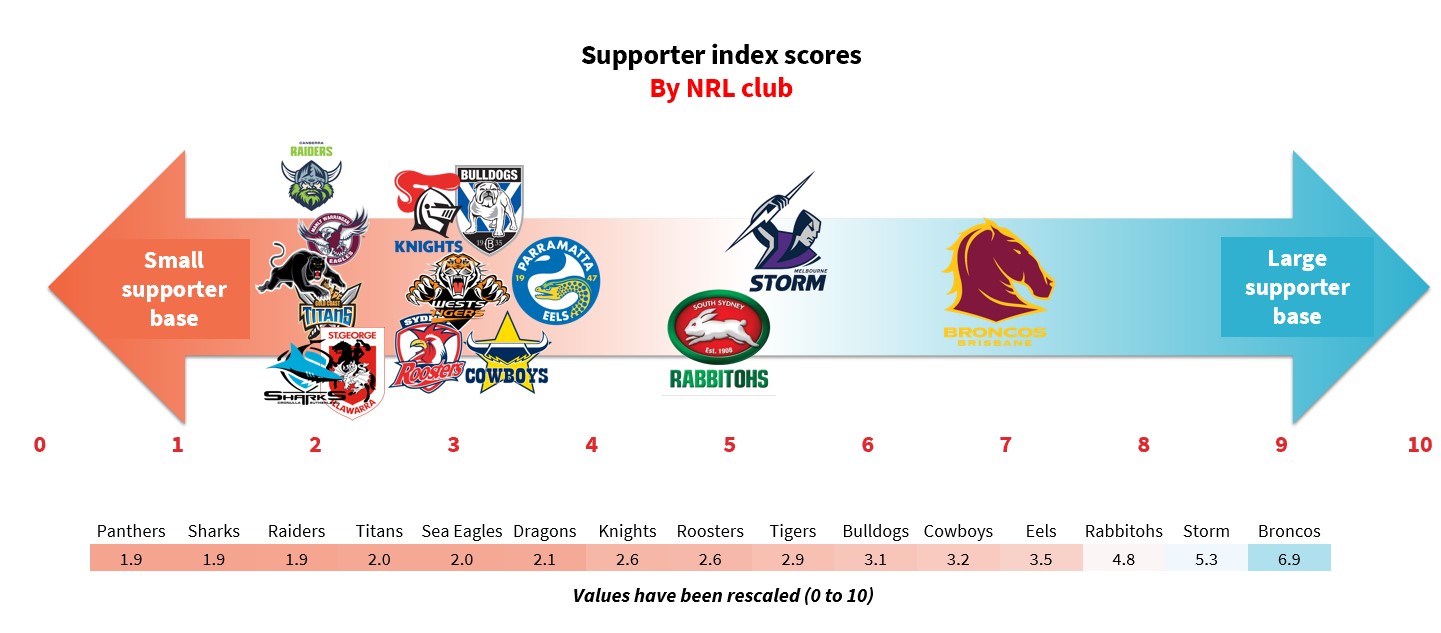
The Broncos are clearly the most supported club in the competition, while the Storm and Rabbitohs are the closest challengers. Which begs the question, do match highlights featuring the Broncos have the highest view counts?
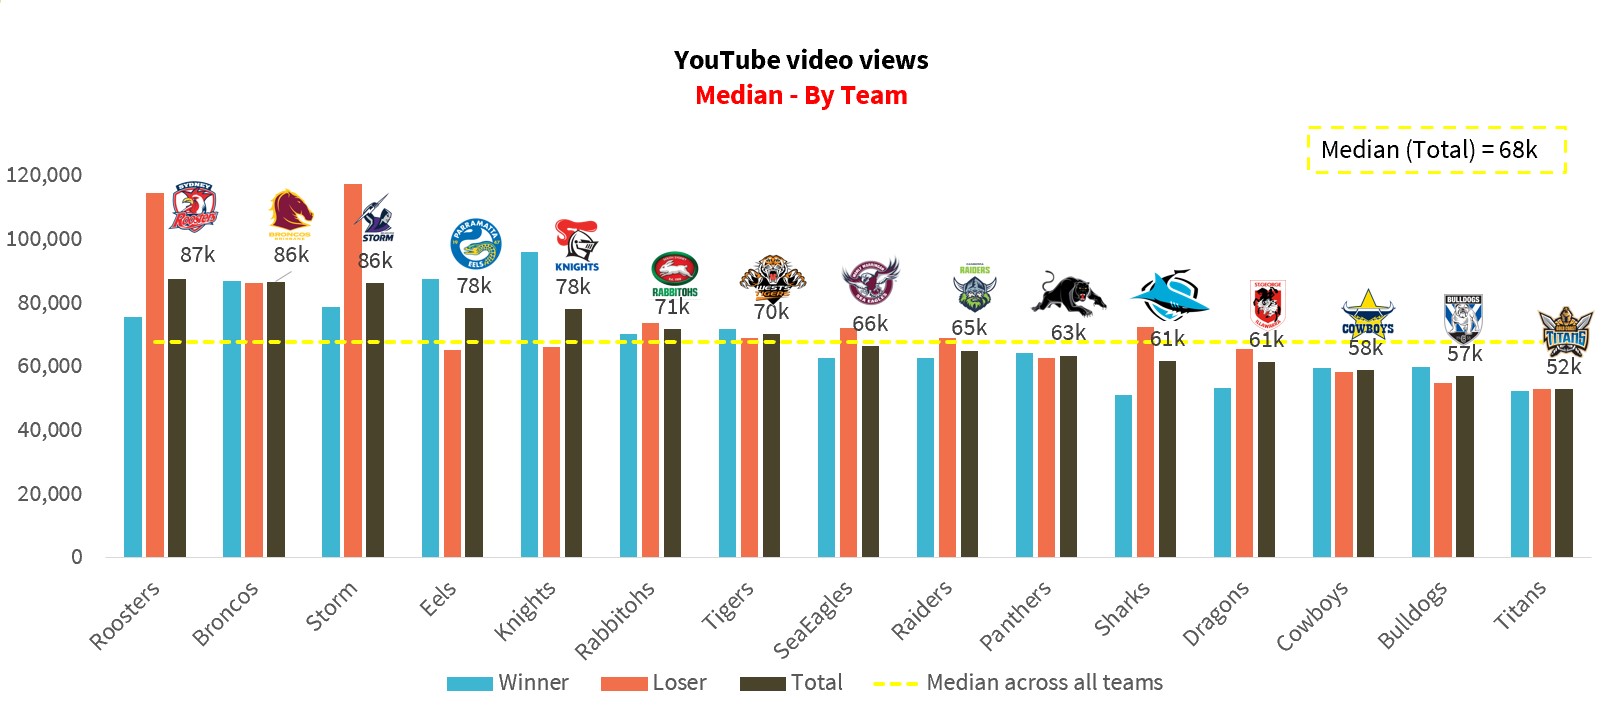
The answer is, well sort of but not really. Games which feature either the Roosters, Broncos, or Storm typically get around 86k views. One big question is how do the Roosters and the Storm get as many views as the Broncos despite having smaller supporter bases…
What is also interesting is the differences in views based on whether the team was the winner or the loser in a match. Both Roosters and the Storm appear to draw a bigger number of viewers when they are the losing teams in a match as opposed to when they are the winner. To me this suggests that viewers are especially interested in seeing a traditional powerhouse team lose.
Speaking of powerhouses and underdogs, let us now look at the relationship between video views and the strength of the teams involved in any given match.
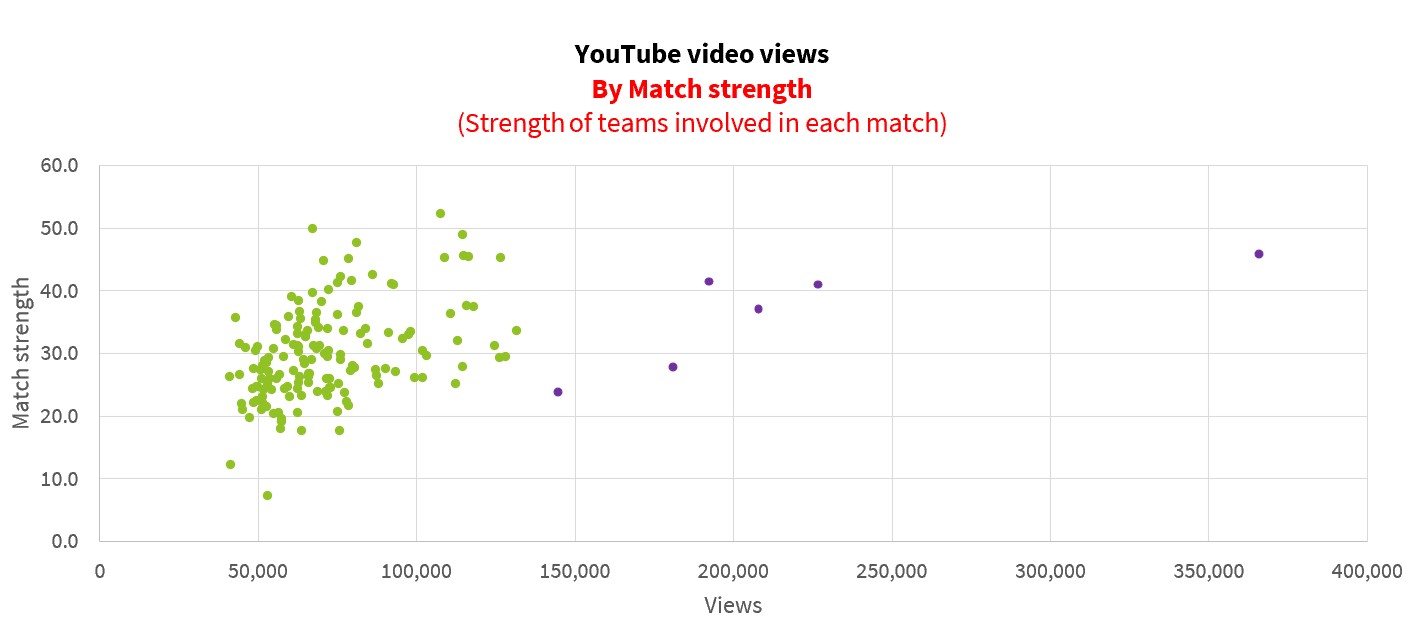
Illustrated above is a new scatterplot, with the horizontal axis again measuring the viewership counts for each match. However, the vertical axis now measures each match based on what I have coined the Match Strength Index. The strength index is based on a team’s most recent results leading up to the match in question. The better a team has performed in its recent matches leading into a new match, the higher its strength index score will be.
Again, like with the supporter metric, we see a moderate positive correlation (+0.40) between match strength index and YouTube video views. A slightly stronger correlation (+0.44) exists when the outliers are removed from the calculation.
Now that we have seen the bivariate relationship between supporter levels and views, and strength levels and views, which teams are underdelivering and which teams are overdelivering? What I mean by underdelivering and overdelivering is circumstances where a team has either lower or higher levels of views on their match video highlights relative to their supporter and strength scores.
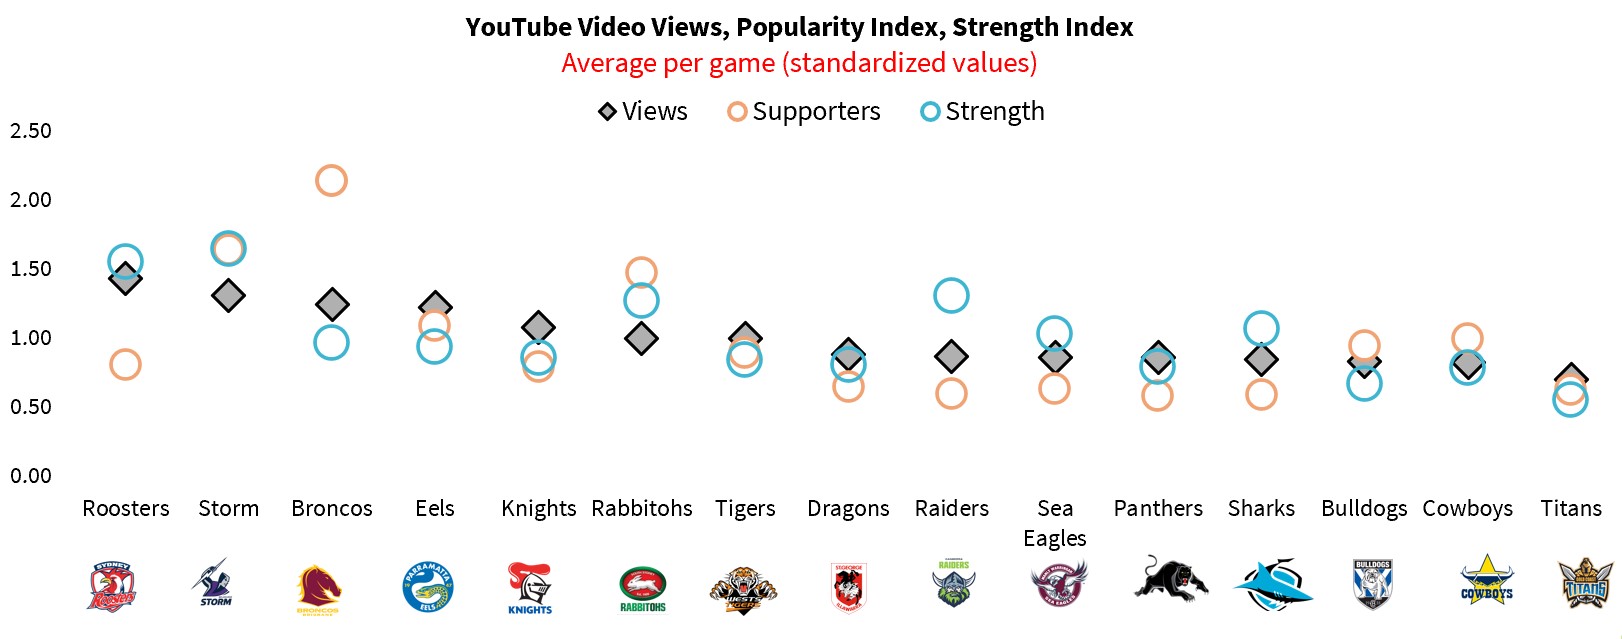
Assessing the above graph, the teams where this phenomenon occurs to a noticeable degree are with the Storm and the Rabbitohs, where both these teams’ views scores are lower than the strength and supporter scores. This suggests these two teams are not delivering as many YouTube video views for their games as they should be. On the flip side, you could also argue that the Knights, and to a lesser extent the Eels, are the only teams overdelivering. This could indicate the supporters of these two teams are more engaged with their teams’ match highlights. It could also indicate that these teams possess individual players that, on average, supporters of opposing clubs deem more worth watching.
How do view counts differ based on the expected result of a match?
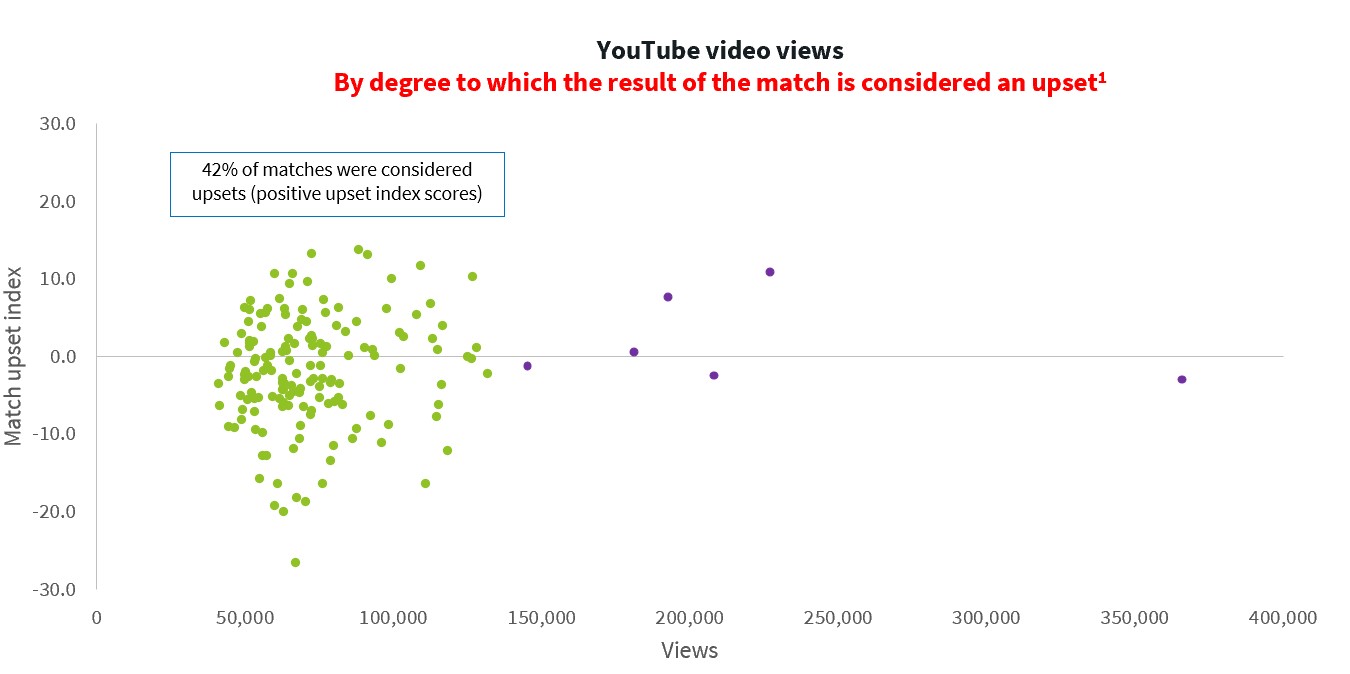
Illustrated above is a new scatterplot, showing again video view counts on the horizontal axis. On the vertical axis is a new metric, which I have coined the Match Upset Index. A positive match upset index score reflects any given match in which the winning team were expected (based on team strength index) to lose prior to the match. And a negative match upset index score reflects any given match in which the winning team were expected to win.
The resulting correlation between video views and match upset scores is a low positive correlation (+0.13). This suggests that as a match becomes more of an upset, it is slightly more likely than normal for video views to increase.
What we have discovered is that the match upset factor is not as influential as the supporter and strength index factors when it comes to determining video views.
Do view counts differ based on score line and number of points scoring events?
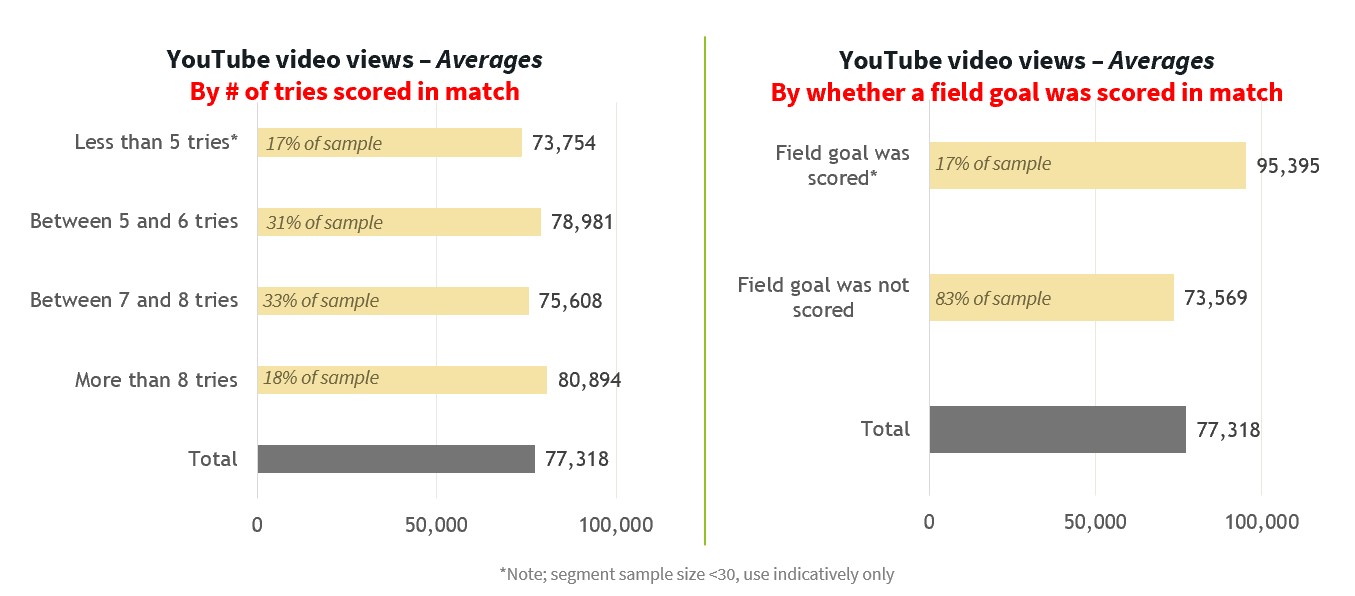
One might expect videos with more tries and field goals to generate more views. However, the relationships here are not as strong as we saw with the supporter and strength metrics. An increase in tries scored in a match typically yields a relatively small increase in views (correlation of +0.07), while a slightly stronger positive correlation (+0.22) exists based on whether a field goal was scored or not.
Does the margin of victory influence viewership levels?
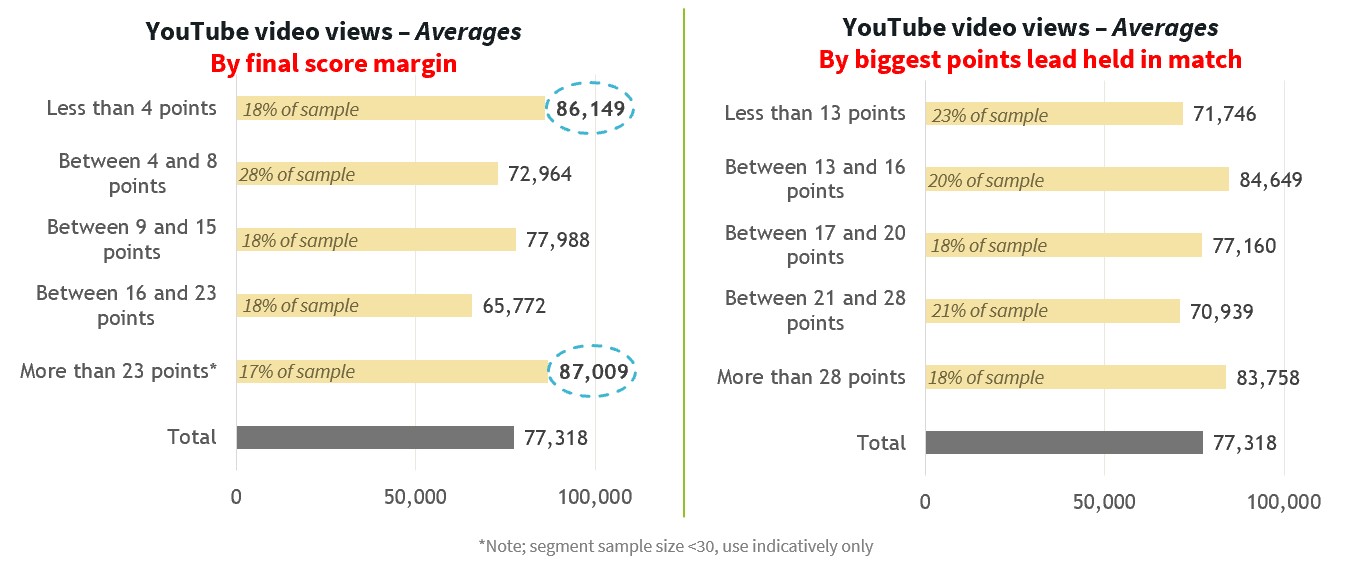
The correlation between video views and the score-line margin is weak (+0.07), however there may be a nonlinear relationship pertaining to relatively low margins and relatively big margins. Matches with final margins less than 4 points and matches with final margins greater than 23 points appear to draw in more views than those matches with final margins between 4 and 23 points. In other words, consumers are more likely to watch a video if the match in question had a tight score line or a massive score line.
On the right-hand side chart featured above we have video views based on the largest points lead held in a match by either the winning or losing team in each match. There does not appear to be any kind of pattern going on here that helps us understand viewership rates better. Which is somewhat surprising given that I would have expected matches that held a close score-line margin throughout the match to be more engaging and thus generate more views.
Does the occurrence of multiple late scoring tries and field goals increase views?
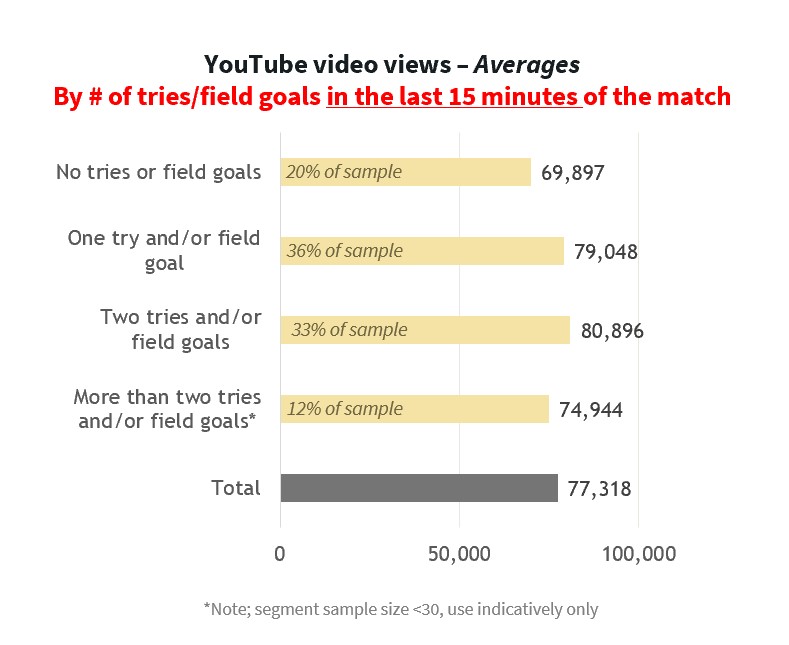
An increase in the amount of tries and field goals scored after the 65th minute of a match does not necessarily result in increased video views.
The correlation between YouTube video views and the number of tries/field goals scored after the 65th minute of a match is a measly +0.04. However, matches featuring no tries or field goals generated less views than matches that do feature late scoring events.
It would appear beneficial for a highlights video package to feature at least one late scoring event but having more than one does not guarantee higher views.
Do view counts differ based on time of the year or on Channel Nine broadcasting?
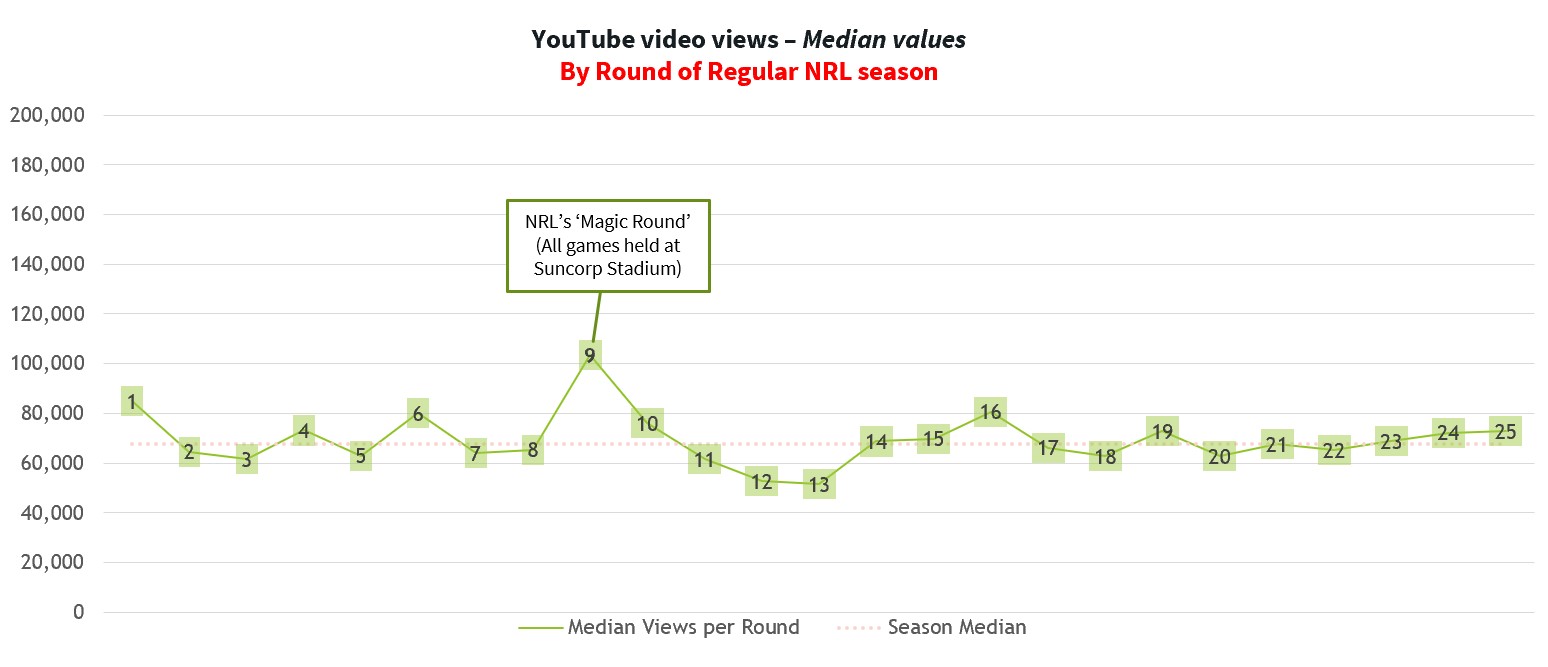
On a per round basis, YouTube video views peaked in Round 9, a round in which all games were played at Brisbane’s Suncorp Stadium.
What was it that made the magic round so viewable? I would argue it was because the actual games were attended by more people.
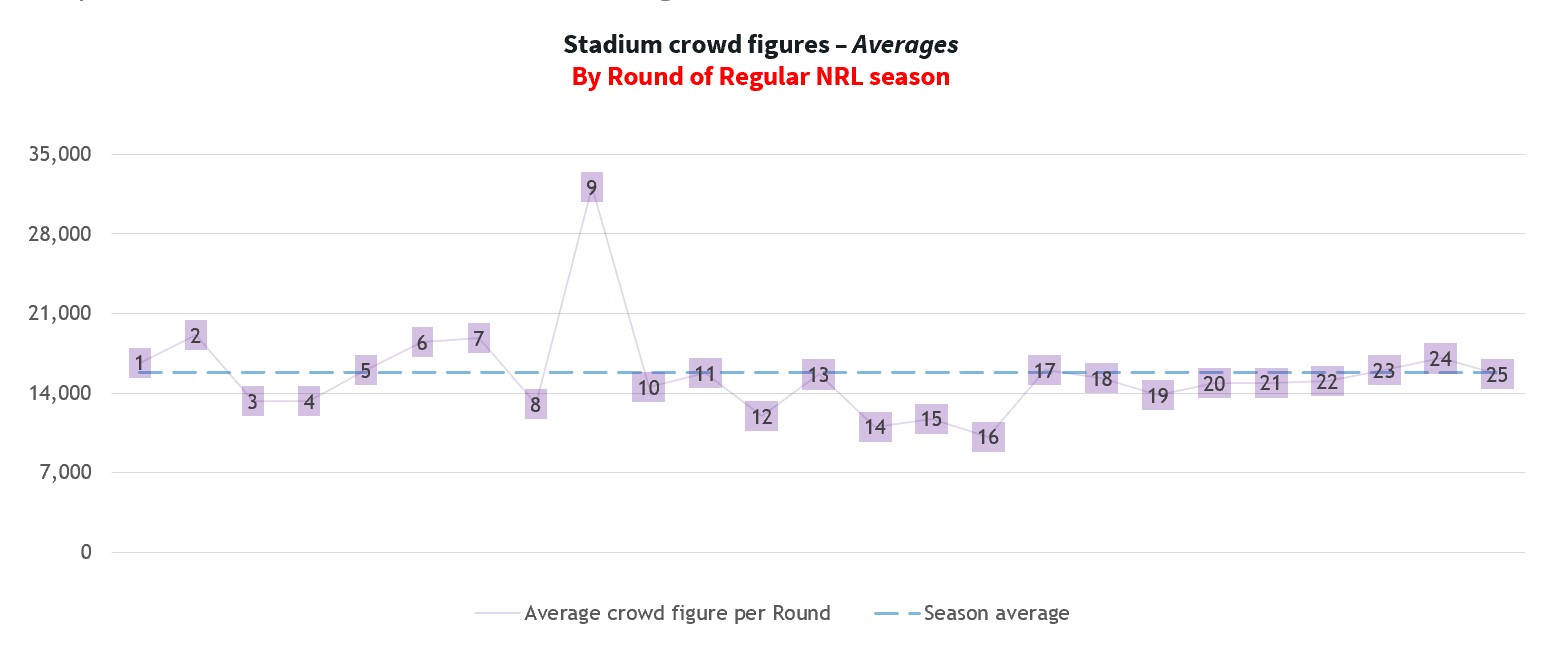
Crowd figures were higher than average in round 9, and there exists a moderate positive correlation (+0.41) between crowd figures and YouTube video views.
Is it that the video highlights came across as more exciting to watch on YouTube due to the larger crowds featured in the highlights? Or is it that teams demonstrated a more attractive style of play that round due to the increase in fans watching? I would lean more towards the first explanation.
What about Channel Nine coverage? After all, the YouTube videos being analysed are uploaded by a channel which is owned and operated by Channel Nine. The video uploaders may be more inclined to promote video highlights of matches that were originally broadcasted on Channel Nine.
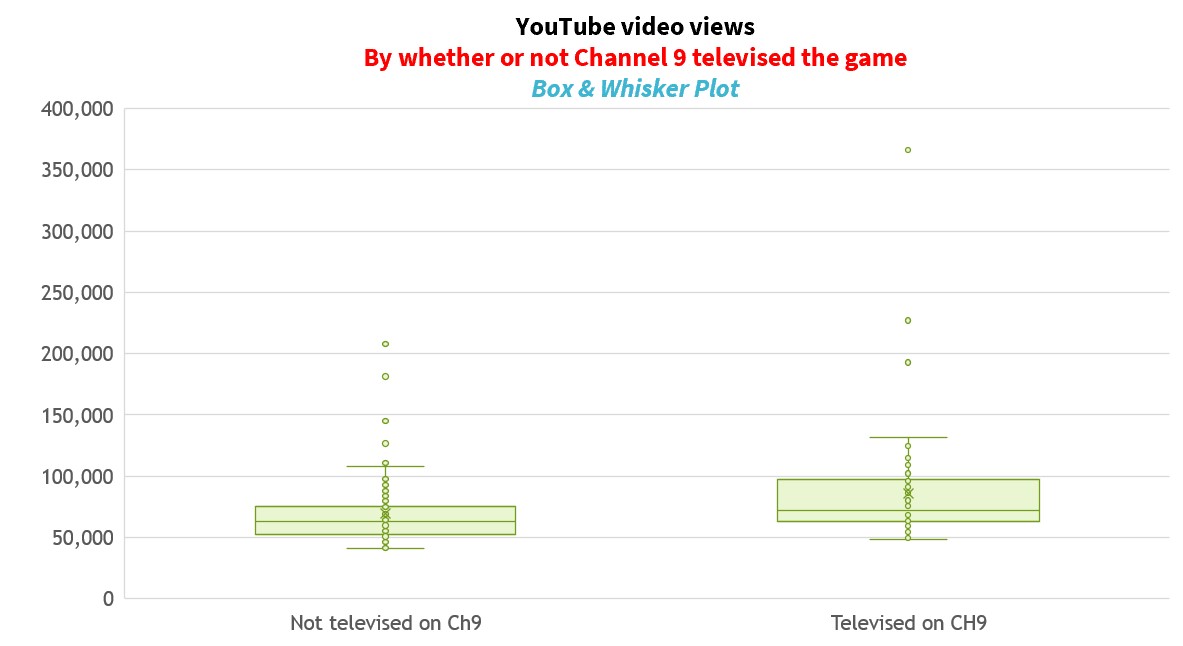
The above graph features box and whisker plots for two segments of data. The segments are based on whether a match was televised on Channel Nine. The box on the left (representing videos of matches which were not originally televised on Channel Nine) is clearly lower than the box on the right, indicating that the distribution of this segment is skewed more towards lower video view values. The boxes themselves reflect the middle 50% of the data points in each of the segments while the upper and lower “whiskers” reflect the minimum and maximum values (excluding outliers). The dots above the box and whiskers reflect the outliers in each segment.
The following table provides further distinguishing characteristics of the two segments:
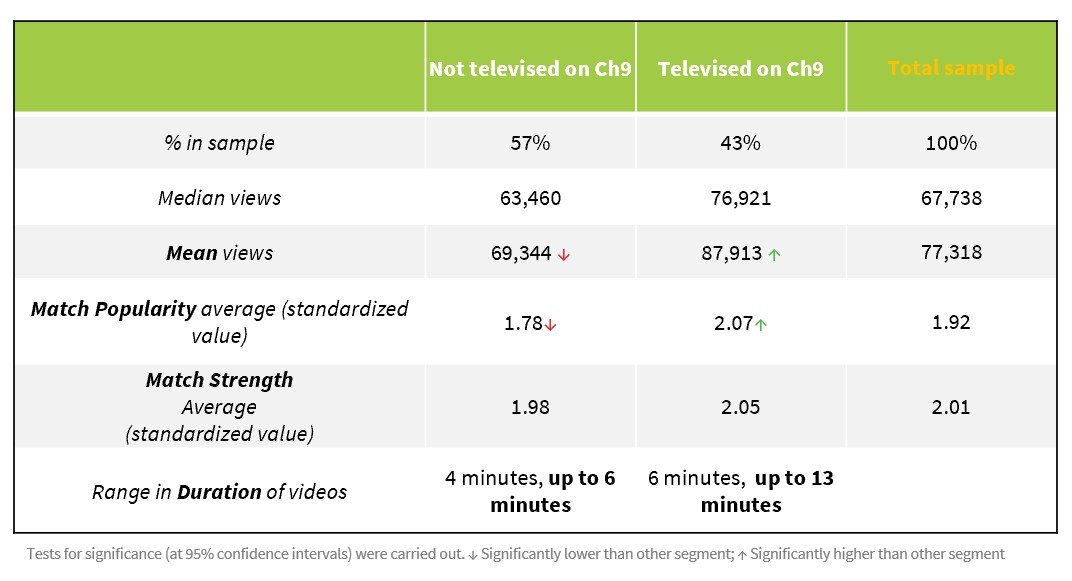
Televised games had a significantly higher amount of views on their YouTube highlights. In my opinion this is because Channel Nine generally picked matches to televise that featured on average more heavily supported teams, as the data in the table shows. Matches that were televised on Channel Nine also had longer durations for their YouTube video highlights (perhaps due to a contractual agreement set in place between broadcasters and the NRL). My hypothesis would be that longer video durations lead to higher views on average, based on my theory that consumers appreciate seeing a wider variety of moments from any given match.
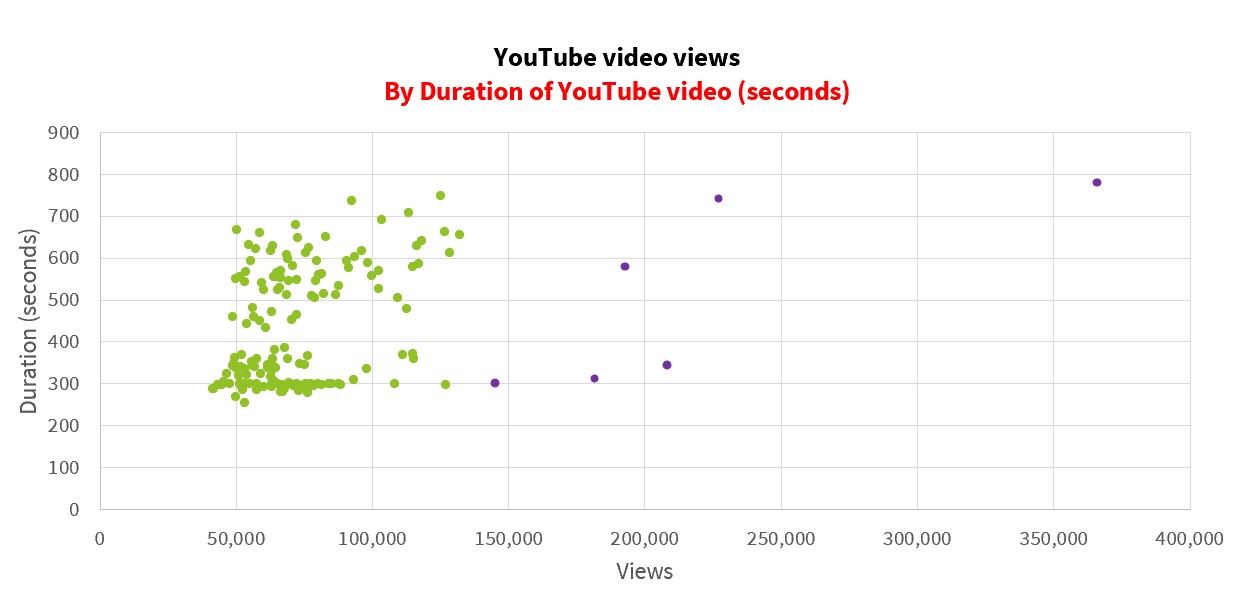
Video duration does seem to have a connection with video views as there exists a moderate positive correlation (+0.37) between the two variables. And for those wondering, the correlation between duration and match strength is much weaker (+0.11).
Modelling the Relationship between Video Views and determining factors
Throughout this report, univariate and bivariate analysis has been presented for the purposes of exploring the factors influencing viewership numbers of YouTube NRL match highlights videos.
Using the insights gained thus far, a multivariate statistical model was created, portraying the relationship between YouTube video views and independent factors.
The model is based on the general statistical technique known as multiple regression analysis.
The main objective of multiple regression analysis is to predict future values of a single dependent variable using known values of multiple independent variables.
However, for this project I have simply used this technique to answer the following two questions:
- How much of the variation in viewership can be explained with a statistical model?
- Which factors are best at explaining the variation in viewership numbers?
Using the variables/metrics detailed throughout this presentation, I experimented with various combinations of independent variable inputs to construct a multiple regression model that maximises the power to predict YouTube video view figures.
I ensured no violations of multiple regression validity assumptions were made (including the prevention of multicollinearity). For the purposes of adhering to these validity assumptions, the dependent variable (YouTube video views) needed to be transformed via a logarithmic transformation, and the six major outlier datapoints in the dataset (discussed in the beginning of this report) were removed.
Each independent variable was normalized (each value scaled to a value equalling between 0 and 1), so that the absolute values of the regression coefficients could be compared for the purposes of determining which independent variables are more important in explaining the variation in video views.
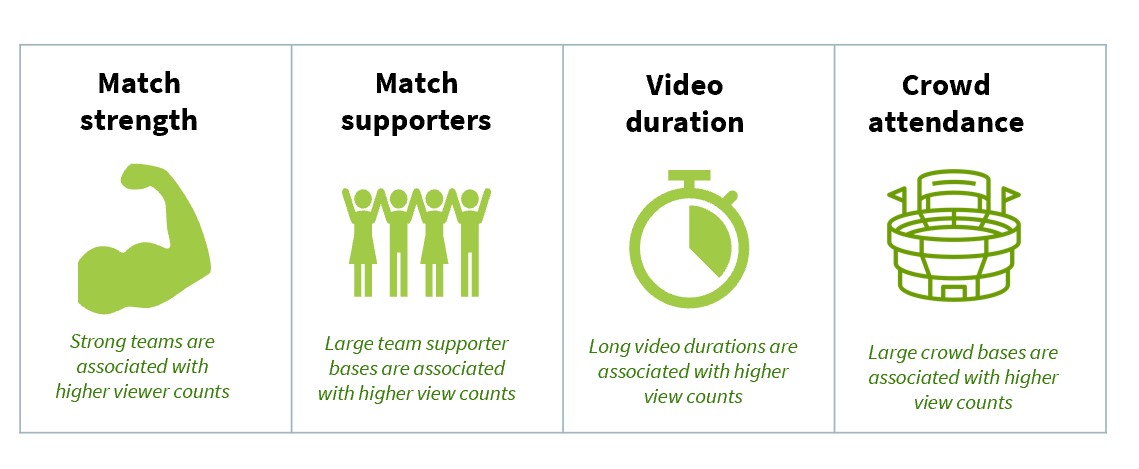
After testing several different multiple regression models, the best combination of factors (out of those featured in this report) at determining video viewership variation, are the following four factors:
-
Match strength index - The degree to which a match features teams who have performed well over recent fixtures.
-
Match supporter index - The combined relative supporter bases of the two teams featured in a match.
-
Video duration - The durational length (measured in seconds) of the YouTube video.
-
Crowd attendance - The crowd attendance figure for a match
A regression model, with these four factors acting as independent variables, accounted for 44% of the variation in YouTube video viewership numbers. This % figure derives from the Adjusted R Square statistic from the regression model output in Excel.
The match strength index is the most powerful predictor, accounting for 41% of the model’s predicting capability. The match supporters, video duration, and crowd attendance factors account for 22%, 22%, and 16% of the model’s predictive capability, respectively.
Key Insights
-
Differences in the form of a team, supporter levels of a team, video duration, and match crowd attendance contribute most to the variation in viewership levels.
-
Combined with the above factors, and upon reviewing the major outliers in the dataset, the following wildcard factors appear to drive extreme increases in view counts:
-
Individual brilliance. E.g. Kalyn Ponga’s flamboyant line break and try in the Round 9 Bulldogs v Knights fixture.
-
Periods of exhilarating attacking play. E.g. Several fast-paced long-range tries featured in the Round 9 Storm v Eels fixture.
-
-
Views are particularly high for matches in which heavyweight teams lose. Matches which featured either the Roosters or the Storm losing garnered much higher views than other games on average.
-
Given that the duration of a video influences view counts, whereas the amount of try scoring events does not, it would seem consumers are interested in seeing a variety of different highlights as opposed to the same type of highlight over and over again.
Recommendations to Stakeholders
-
Inject more uniqueness and novelty into the promotion of seasonal fixtures.
- The ‘Magic Round’ featured in Round 9 attracted a higher than average amount of video views. Thus, it would make sense to add more novel elements to other rounds. E.g. A round where all matches are played overseas. E.g. A round where all teams wear strikingly different jerseys (like the matches where teams wore jerseys with superhero designs).
-
Add more narrative style audio-visual elements to the highlights packages. For instance:
-
Include video intros that focus on enhancing the magnitude of a match prior to showing the actual match highlights. These could be short 15 second audio bites overlaid on top of footage of the players running out onto the ground.
-
Have the voiceover commentators refer to club rivalries.
-
Show passionate supporters in the crowd.
-
Highlight individual player matchups while exaggerating the unique talents of certain players.
-
Show subtle visual prompts updating the score-line and timepoints of each separate highlight.
-
-
Emphasis should be placed on the uniqueness and variety of highlights shown in each YouTube video, as opposed to showing a video which just seems to just repeatedly show each try scoring event in a back-to-back sequence.
-
Further analysis of YouTube video views should incorporate the following metrics:
-
A measurement relating to the characteristics of the commentary on each video. E.g. Which commentators are featured in a match, and how memorable is their input.
-
Types of tries scored. E.g. How many long-range tries are scored, how many tries from kicks are scored, etc.
-
Player popularity and number of times a popular player scores or has a considerable impact in a game. E.g. How many times in a match did Kalyn Ponga score or assist a try?
-
Number and type of non-scoring events featured in video. E.g. Did a highlights video feature a heated dispute between several players?
-
View counts should ideally be measured at a specific and consistent timepoint. I.e. 72 hours after the completion of each match.
-